2025 · Cartography · Data visualization
Lab
The web is ephemeral and over the years so many things I have built have disappeared. Here I collect some experiments, write-ups, snapshots, and other things I have built, hoping to preserve them.
Mainly stuff I built for fun, or to experiment with new technologies. A few things I built for work.
2024 · Cartography · Data visualization
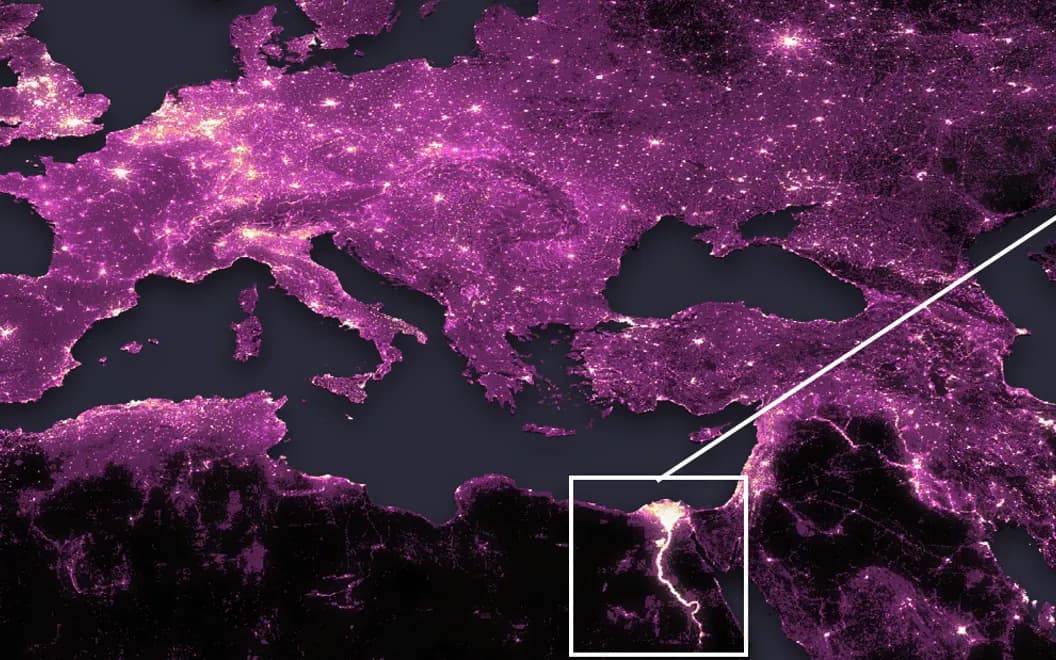
World Population Facts
A world population map created for #30daymapchallenge 2024, highlighting key population facts like the northern hemisphere dominance and future megacity predictions. Created with QGIS and the Global Human Settlement Layer.
2024 · react-three-fiber · d3-force
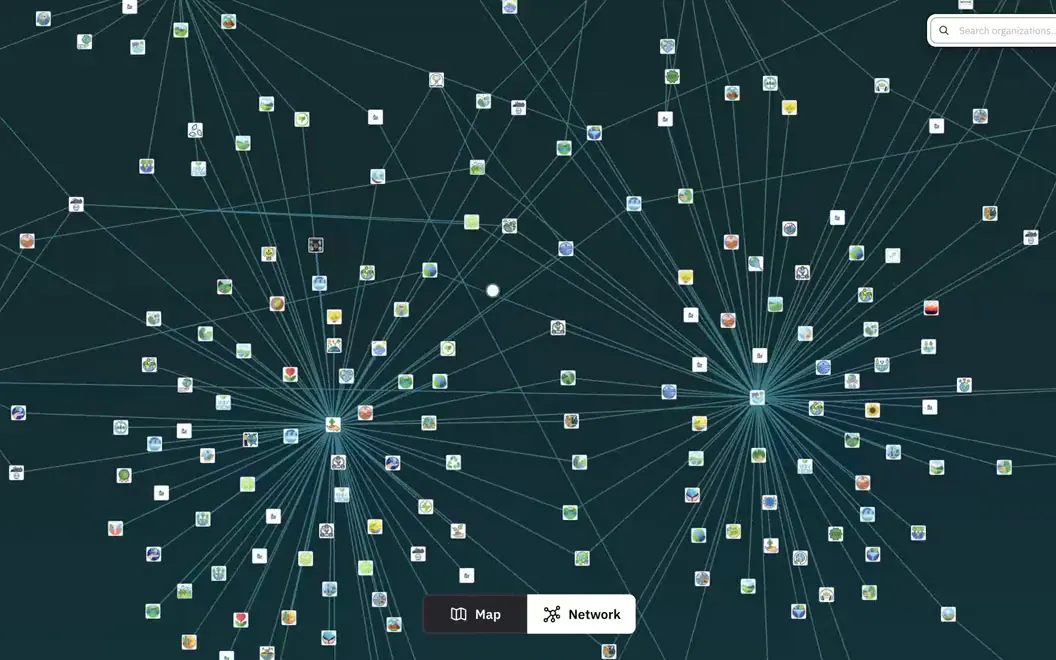
Keeping a force-directed organisation graph off the main thread
A force-directed graph of Restor's organisation network, with the simulation running in a Web Worker and the rendering done in React Three Fiber instead of SVG.
2023 · QGIS · Affinity
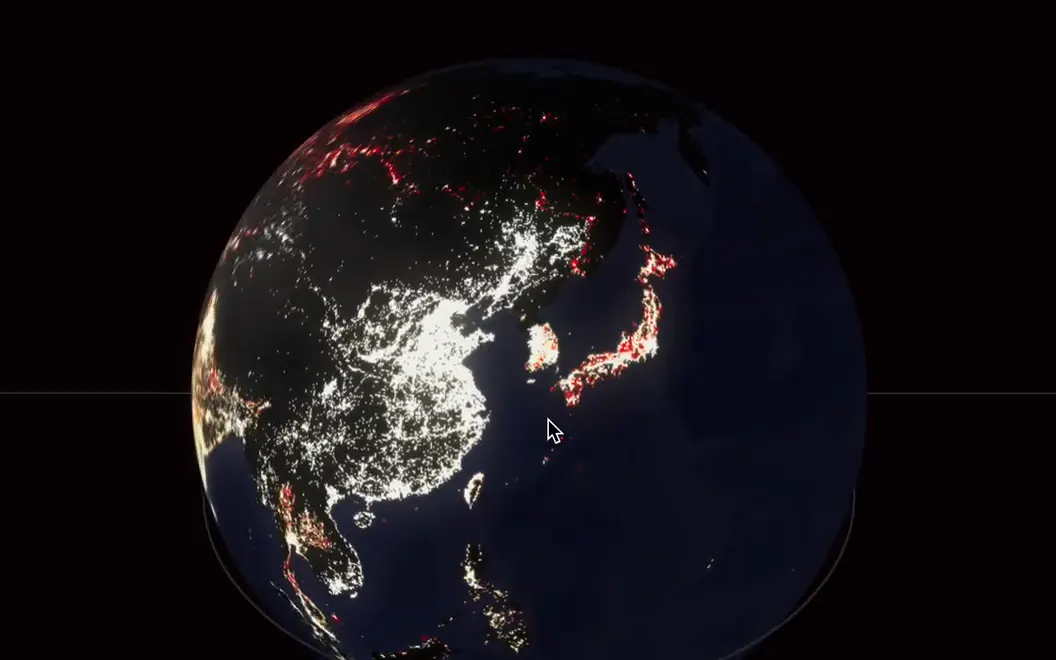
Global divides, mapping global population, forests, carbon, and pollution
Mapping global population, forests, carbon, and pollution.
2023 · Cartography · Data visualization
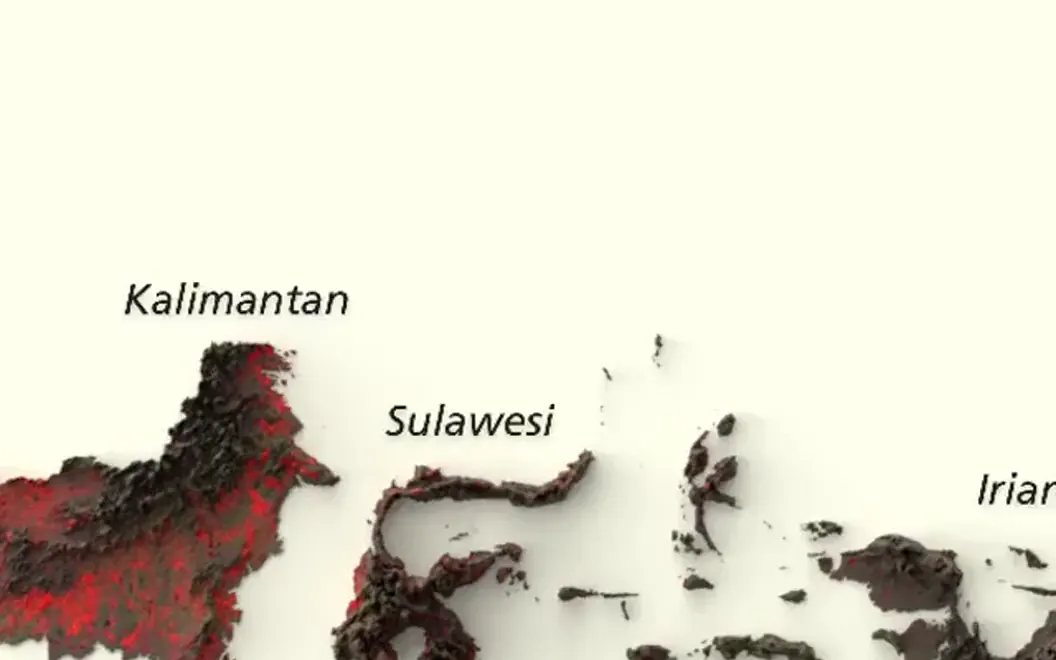
Tree Cover Loss in Indonesia
Animated 3D relief map of tree cover loss in Indonesia (2001-2020), based on data from Hansen, UMD, Google, USGS, and NASA.
2020 · react-three-fiber · WebGL
36 Days of Type
A few submissions to the 36 Days of Type challenge. Built with code instead of design software like a smarter person would.
2020 · CSS · JavaScript
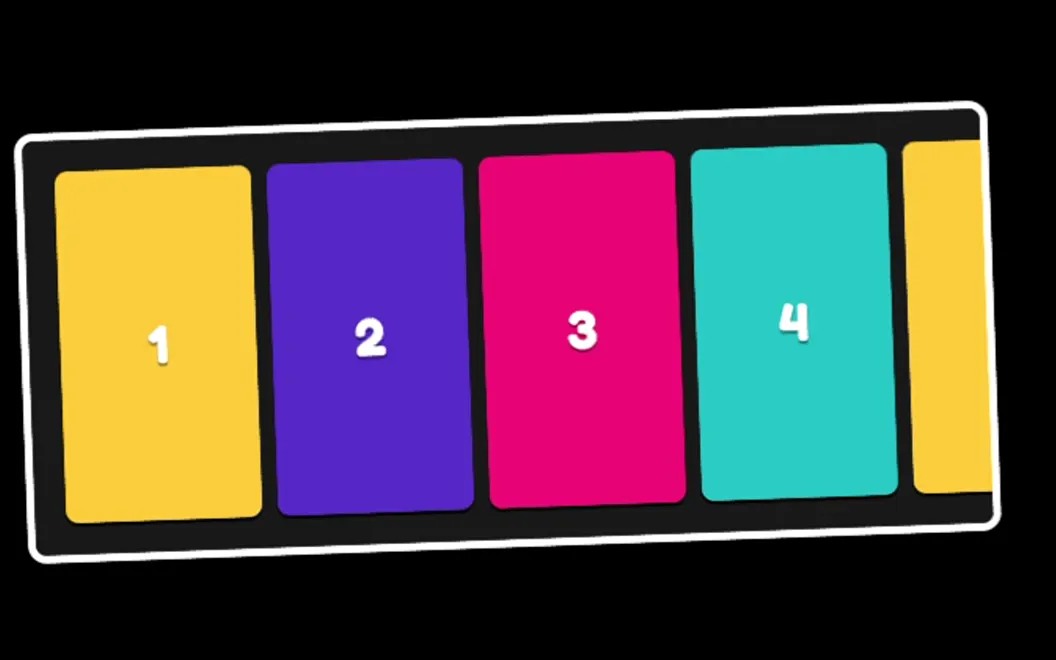
Creating practical Instagram-like galleries and horizontal lists with CSS scroll snapping
A practical guide to creating Instagram-like galleries with CSS scroll snapping.
2020 · React · Animation
How I Transitioned from Ease to Spring Animations
Lessons learned while building react-spring visualizer.
2020 · Mapbox · JavaScript
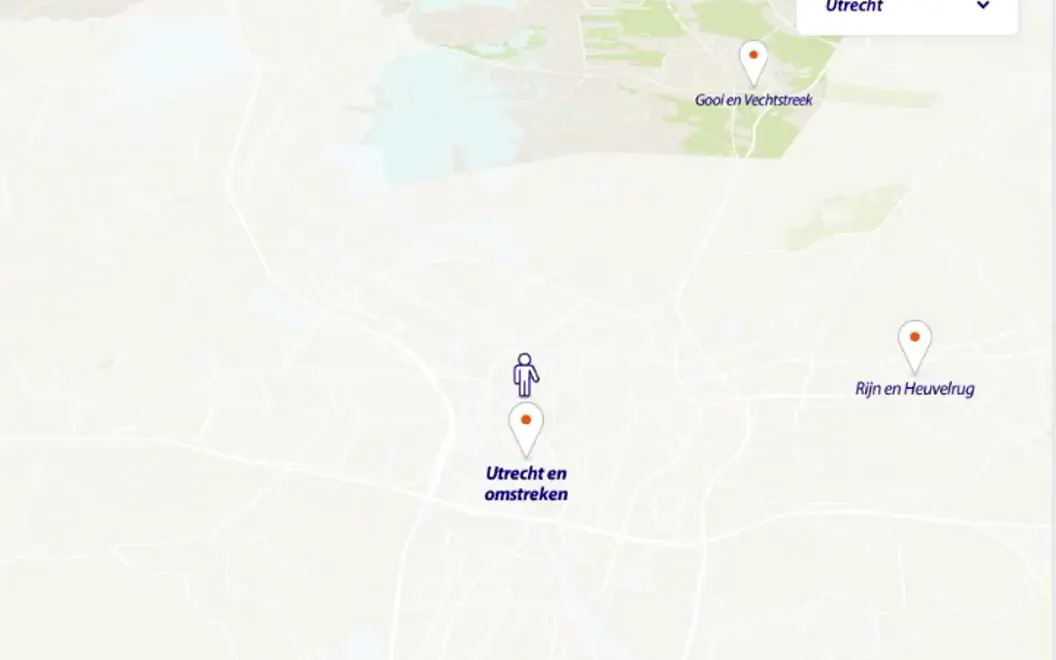
Rabobank - Easter egg
A Mapbox-powered easter egg for Rabobank: click “find my location” and a little dude welcomes you, right at your spot! 🙈.
2020 · React · JavaScript
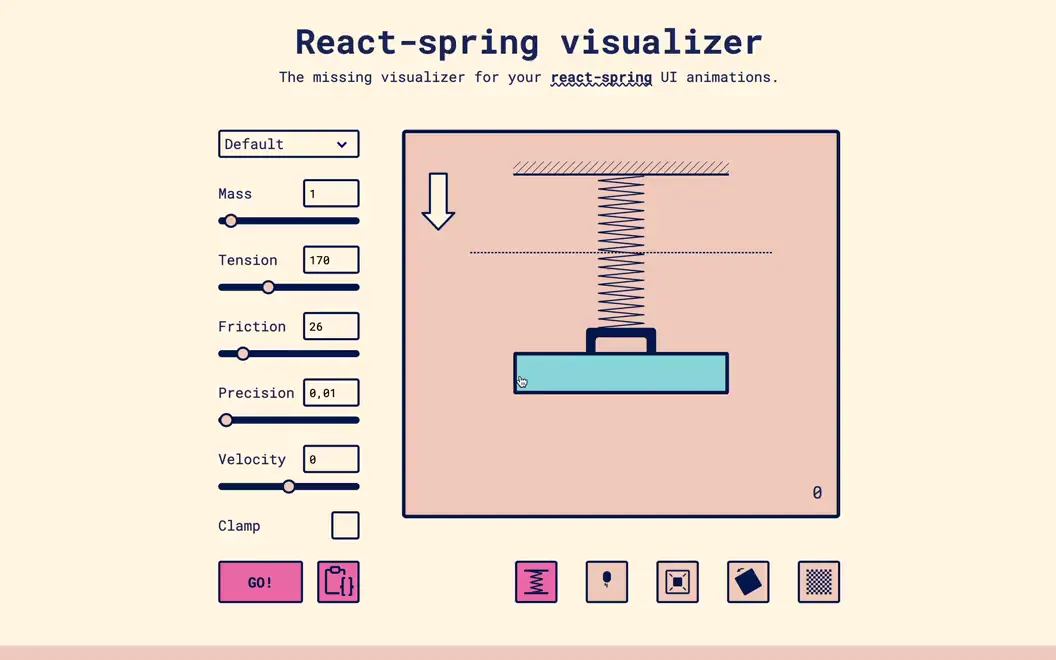
React-spring visualizer
Get the most out of your react-spring configuration with React Spring Visualizer.
2019 · WebGL · Math
Lorenz Attractor in WebGL
A WebGL visualization of the Lorenz Attractor, demonstrating chaos theory and the butterfly effect in action.
2017 · WebAudio · SVG
Frequency analyzer with WebAudio API
An animated SVG boombox which analyses tracks and reacts by displaying the displaying the frequency data in a bar chart and expanding the speakers.
2016 · P5.js · Canvas
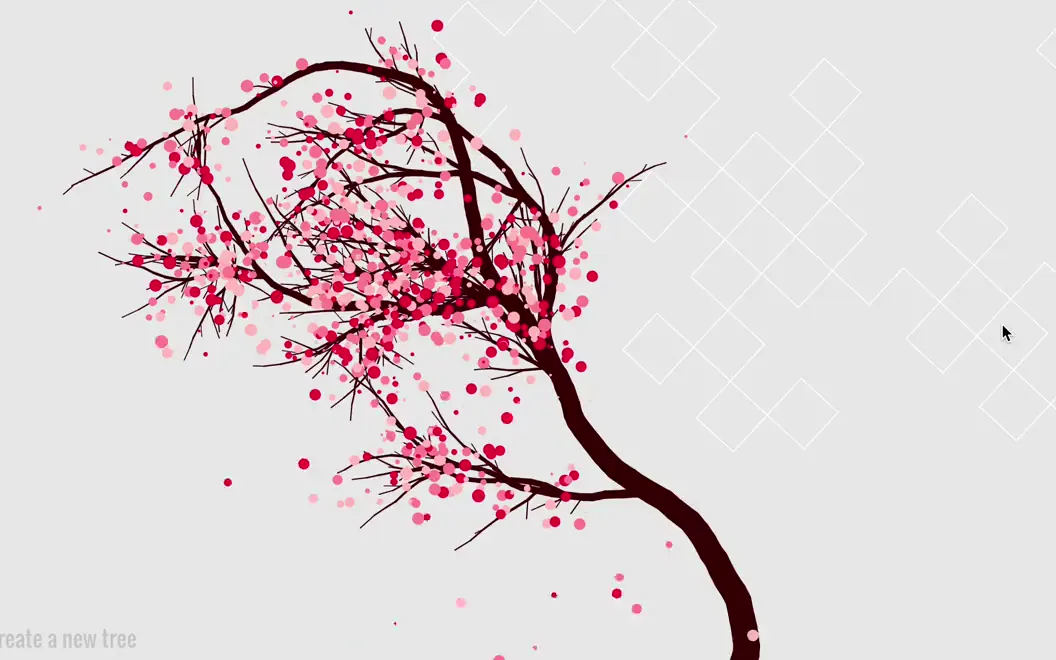
Generated Sakura - Nature of code - Fractals
Exploring fractals and Perlin noise with P5.js.